Kirjojen hintavertailu. Mukana 12 591 797 kirjaa ja 12 kauppaa.

Kirjailija

Lie-Jane Kao

Kirjat ja teokset yhdessä paikassa: 3 kirjaa, julkaisuja vuosilta 2014-2024, suosituimpien joukossa Essentials of Excel VBA, Python, and R. Vertaile teosten hintoja ja tarkista saatavuus suomalaisista kirjakaupoista.

Mukana myös kirjoitusasut: Lie Jane Kao

3 kirjaa

Kirjojen julkaisuhaarukka 2014-2024.

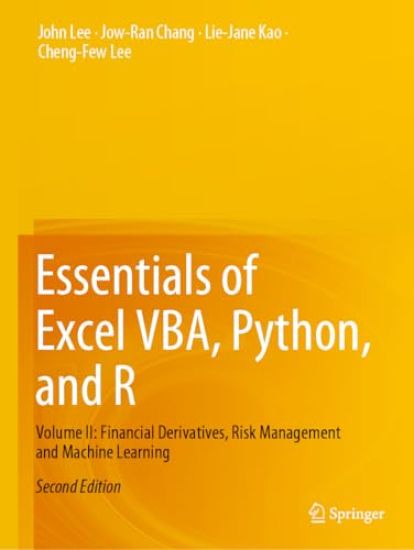
Essentials of Excel VBA, Python, and R

Essentials of Excel VBA, Python, and R

John Lee; Jow-Ran Chang; Lie-Jane Kao; Cheng-Few Lee

Springer International Publishing AG
2024
nidottu
This advanced textbook for business statistics teaches, statistical analyses and research methods utilizing business case studies and financial data with the applications of Excel VBA, Python and R. Each chapter engages the reader with sample data drawn from individual stocks, stock indices, options, and futures. Now in its second edition, it has been expanded into two volumes, each of which is devoted to specific parts of the business analytics curriculum. To reflect the current age of data science and machine learning, the used applications have been updated from Minitab and SAS to Python and R, so that readers will be better prepared for the current industry.This second volume is designed for advanced courses in financial derivatives, risk management, and machine learning and financial management. In this volume we extensively use Excel, Python, and R to analyze the above-mentioned topics. It is also a comprehensive reference for active statistical finance scholars and business analysts who are looking to upgrade their toolkits. Readers can look to the first volume for dedicated content on financial statistics, and portfolio analysis.
Essentials of Excel VBA, Python, and R

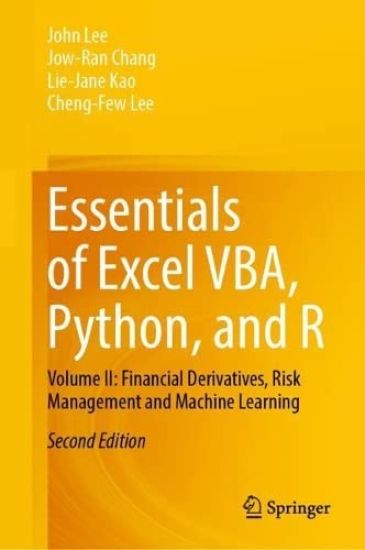
Essentials of Excel VBA, Python, and R

John Lee; Jow-Ran Chang; Lie-Jane Kao; Cheng-Few Lee

Springer International Publishing AG
2023
sidottu
This advanced textbook for business statistics teaches, statistical analyses and research methods utilizing business case studies and financial data with the applications of Excel VBA, Python and R. Each chapter engages the reader with sample data drawn from individual stocks, stock indices, options, and futures. Now in its second edition, it has been expanded into two volumes, each of which is devoted to specific parts of the business analytics curriculum. To reflect the current age of data science and machine learning, the used applications have been updated from Minitab and SAS to Python and R, so that readers will be better prepared for the current industry.This second volume is designed for advanced courses in financial derivatives, risk management, and machine learning and financial management. In this volume we extensively use Excel, Python, and R to analyze the above-mentioned topics. It is also a comprehensive reference for active statistical finance scholars and business analysts who are looking to upgrade their toolkits. Readers can look to the first volume for dedicated content on financial statistics, and portfolio analysis.
Study Guide for Statistics for Business and Financial Economics

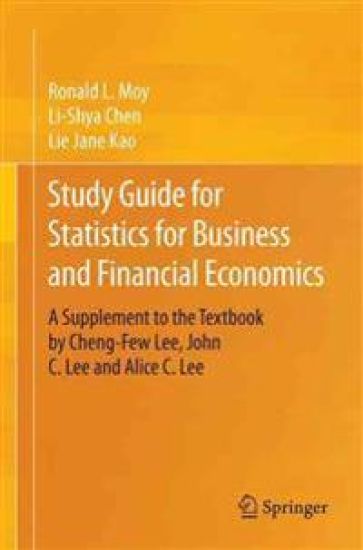
Study Guide for Statistics for Business and Financial Economics

Ronald L. Moy; Li-Shya Chen; Lie Jane Kao

Springer International Publishing AG
2014
nidottu
This Study Guide accompanies Statistics for Business and Financial Economics, 3rd Ed. (Springer, 2013), which is the most definitive Business Statistics book to use Finance, Economics, and Accounting data throughout the entire book. The Study Guide contains unique chapter reviews for each chapter in the textbook, formulas, examples and additional exercises to enhance topics and their application. Solutions are included so students can evaluate their own understanding of the material. With more real-life data sets than the other books on the market, this study guide and the textbook that it accompanies, give readers all the tools they need to learn material in class and on their own. It is immediately applicable to facing uncertainty and the science of good decision making in financial analysis, econometrics, auditing, production and operations, and marketing research. Data that is analyzed may be collected by companies in the course of their business or by governmental agencies. Students in business degree programs will find this material particularly useful to their other courses and future work.